Debugging PHP in Pattern Lab using Xdebug
Part I. Install the Xdebug extension
First you need to install the Xdebug PHP extension. Quickstart steps are summarized below, but the following resources may help if you get stuck or something is unclear.
- https://xdebug.org/docs/install#pecl
- https://www.jetbrains.com/help/phpstorm/configuring-xdebug.html#downloadAndInstall
- https://www.jetbrains.com/help/phpstorm/configuring-xdebug.html#updatingPhpIni
Step 1. Install xdebug globally with PECL.
pecl install xdebugAfter installation is complete, the output from that command should tell you where to find xdebug.so. Make a note of that.
Step 2. Edit your php.ini file
Find the php.ini file that's in use
php --ini(the output will provide the path to a 'Loaded Configuration File')
Edit that file and add the following, making sure to update the path to xdebug.so with your actual path.
[Xdebug]
zend_extension="/path/to/xdebug.so"
xdebug.remote_enable=1
xdebug.remote_autostart=1
xdebug.remote_port="9000"
Note that your php.ini file may already contain a zend_extension config line-- if so, delete/replace it with the above.
Step 3. Confirm that the xdebug extension is installed
php --versionYou should see something like this in the output
PHP 7.2.12 (cli) (built: Nov  9 2018 11:03:05) ( NTS )
Copyright (c) 1997-2018 The PHP Group
Zend Engine v3.2.0, Copyright (c) 1998-2018 Zend Technologies
   with Xdebug v2.6.1, Copyright (c) 2002-2018, by Derick Rethans
   with Zend OPcache v7.2.12, Copyright (c) 1999-2018, by Zend Technologies
Part II. Configure and run Xdebug in your IDE
Note: Many IDEs besides PHPStorm and VS Code support Xdebug-- refer to their documentation for specifics, but the steps below should still provide helpful high level guidance on what you're doing.
PHPStorm
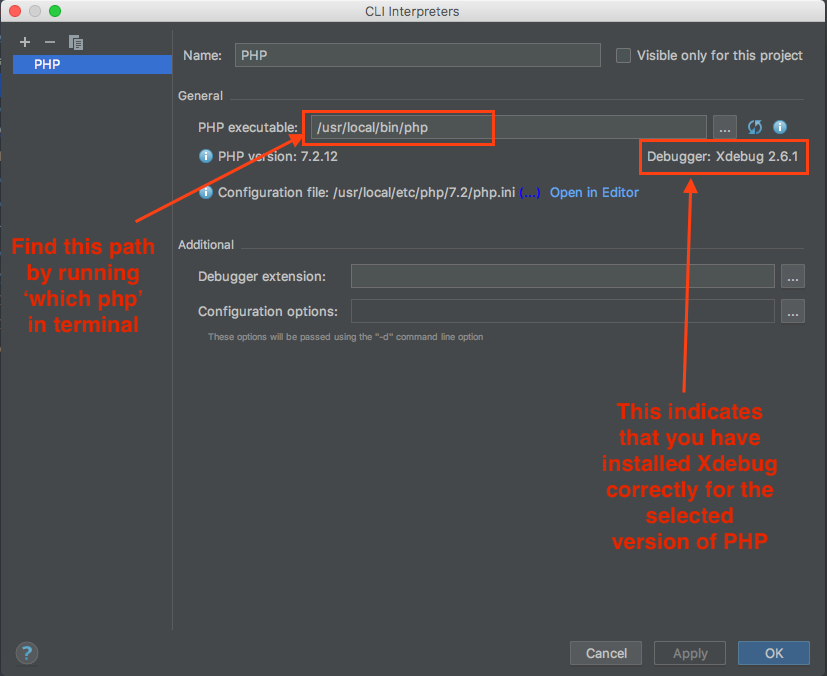
Step 1. Configure the PHP executable
- In PHPStorm preferences, go to
Languages & Frameworks>PHP - In the CLI Interpreter box, point to your system's PHP executable (i.e. the same version of PHP that will be used
when you compile Pattern Lab). If it doesn't sppear in the dropdown, click the
...to the right of the form field to manually enter the path, which you can find in terminal with:which php - Confirm that it says "Debugger: Xdebug [version]" and not "Debugger: Not installed" (in which case something went wrong in part I).
Step 2. Create a Run/Debug configuration
- In PHPStorm's
Editmenu, go toEdit Configurations.... - Click the plus sign to add a new debug configuration and select
PHP Scriptin the dropdown- In the
Namefield, putPattern Lab - In the
Filefield, add the absolute path todocs-site/core/console - In the
Argumentsfield, add--generate - In the
Interpreter Optionsfield, add-dmemory_limit=4048M -dzend_extension="/path/to/xdebug.so"(replace the path to xdebug.so) - In the
Custom working directoryfield, add the absolute path to thedocs-sitedirectory
- In the
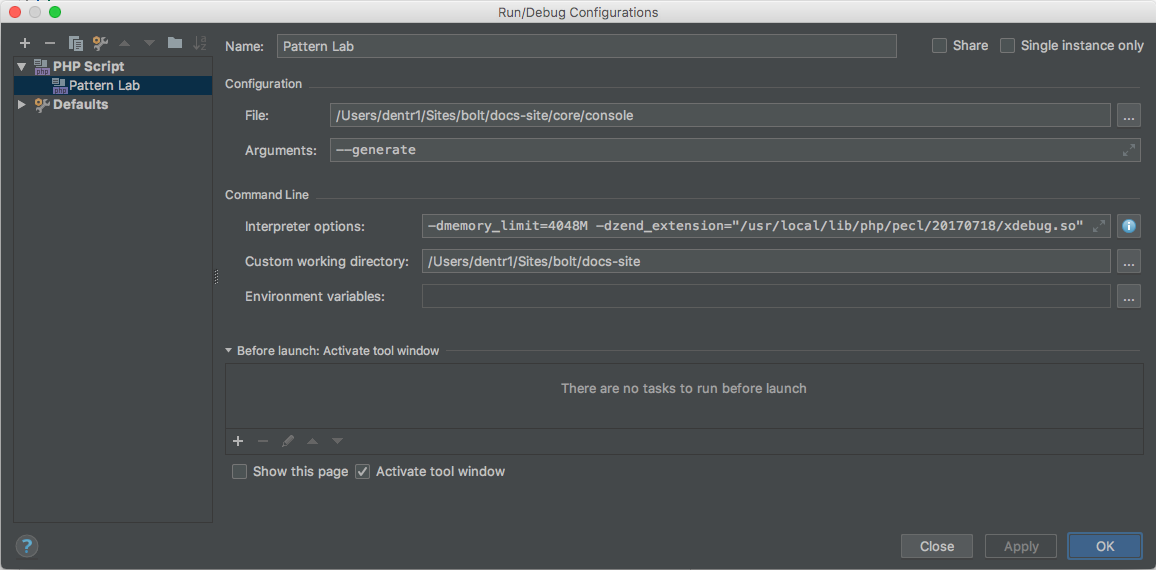
Explanation: you're effectively setting up a shell command that will build pattern lab when it runs (remember, the PHP code in Pattern Lab is only executed at build time-- when you subsequently load pages in your browser, you're just viewing the static files that were created from that build process). The command will look something like this
/usr/local/bin/php -dxdebug.remote_enable=1 -dxdebug.remote_mode=req -dxdebug.remote_port=9000 -dxdebug.remote_host=127.0.0.1 -dmemory_limit=4048M -dzend_extension=/usr/local/lib/php/pecl/20170718/xdebug.so /Users/dentr1/Sites/bolt/docs-site/core/console --generateStep 3. Set a breakpoint
Open the docs-site/core/console PHP file in PHPStorm and set a breakpoint by clicking in the left margin:
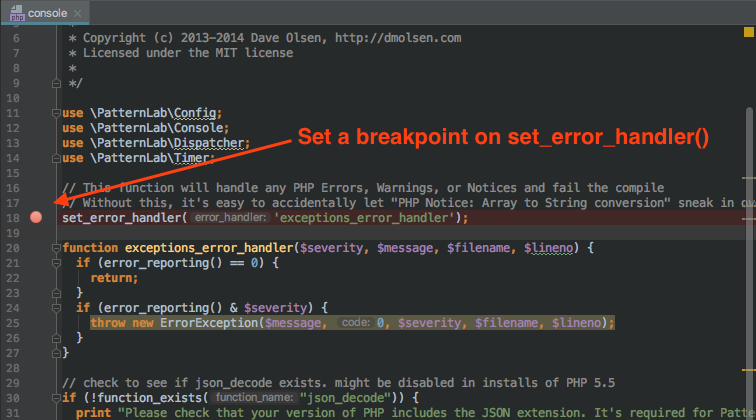
(Of course, when you start debugging, you'll set breakpoints in the PHP file you actually want to inspect. We use
docs-site/core/console here because it is guaranteed to be executed at the beginning of every PL compile).
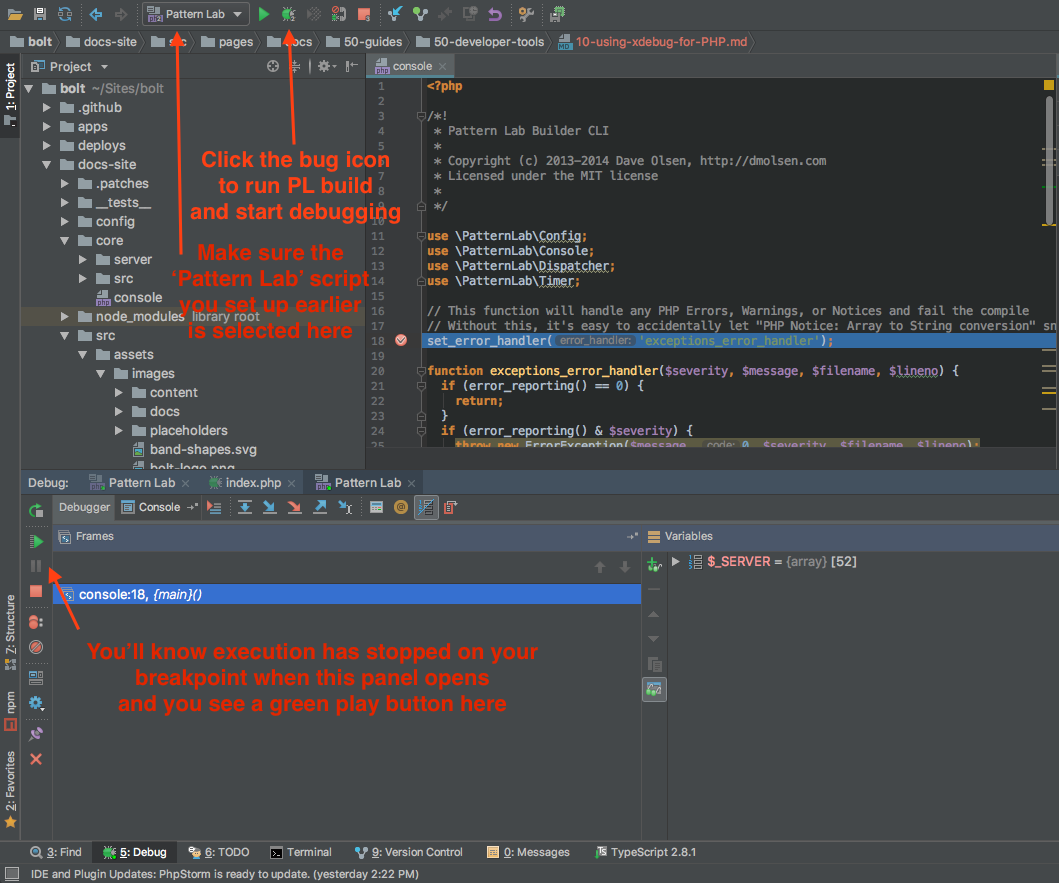
Step 4. Execute your Run/Debug configuration
Click the bug icon in PHPStorm to run pattern lab compile using the debug configuration. If you've done it right, execution should pause on the breakpoint you set:
Step 5. Cleanup
Comment out the xdebug lines you previously added to php.ini. Since PHP options are now being set at runtime by the Run/Debug script you set up in Step 2, you don't need them set globally anymore. Disabling them will disable xdebug when you're not actively debugging, which will improve performance significantly.
[Xdebug]
; zend_extension="/path/to/xdebug.so"
; xdebug.remote_enable=1
; xdebug.remote_autostart=1
; xdebug.remote_port="9000"
For more information, see:
VS Code
Step 1. Install "PHP Debug" Extension
- In VS Code, go to "Extensions" (Shift-Cmd-E).
- Search the Extensions Marketplace for "PHP Debug" (this one)
- Install "PHP Debug" and reload Workspace
Step 2. Configure "PHP Debug" in the Debugger
- In VS Code, open the "Debug" pane (Shift-Cmd-D).
- At the top of the "Debug" pane you will see a little gear icon.
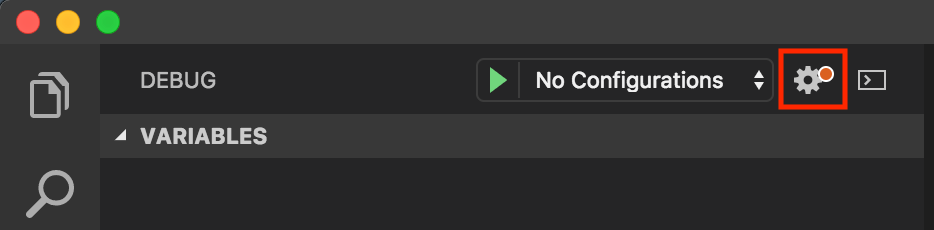
- Click on the gear icon to configure
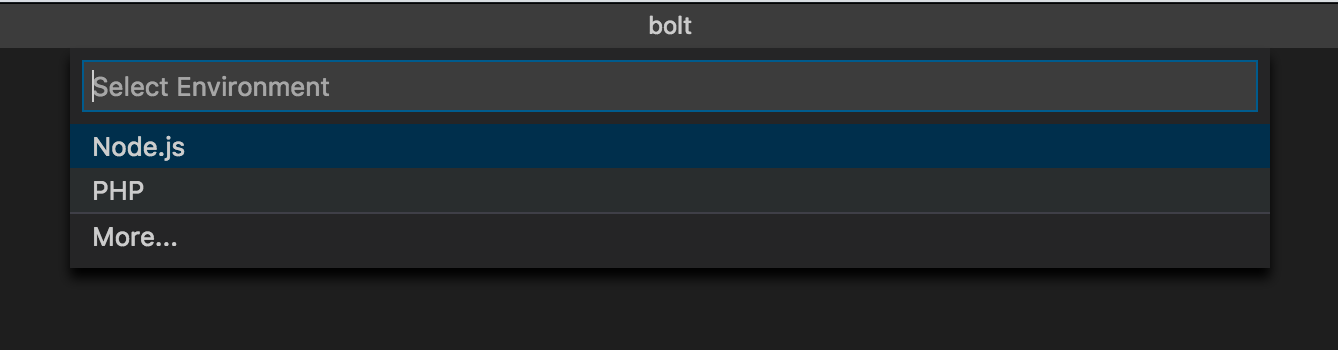
launch.json - You will see a Menu with the placeholder text "Select Environment".
- Choose "PHP".
- This adds a
launch.jsonconfiguration file to your Workspace with two PHP debug modes:- "Listen for XDebug"
- "Launch currently open script"
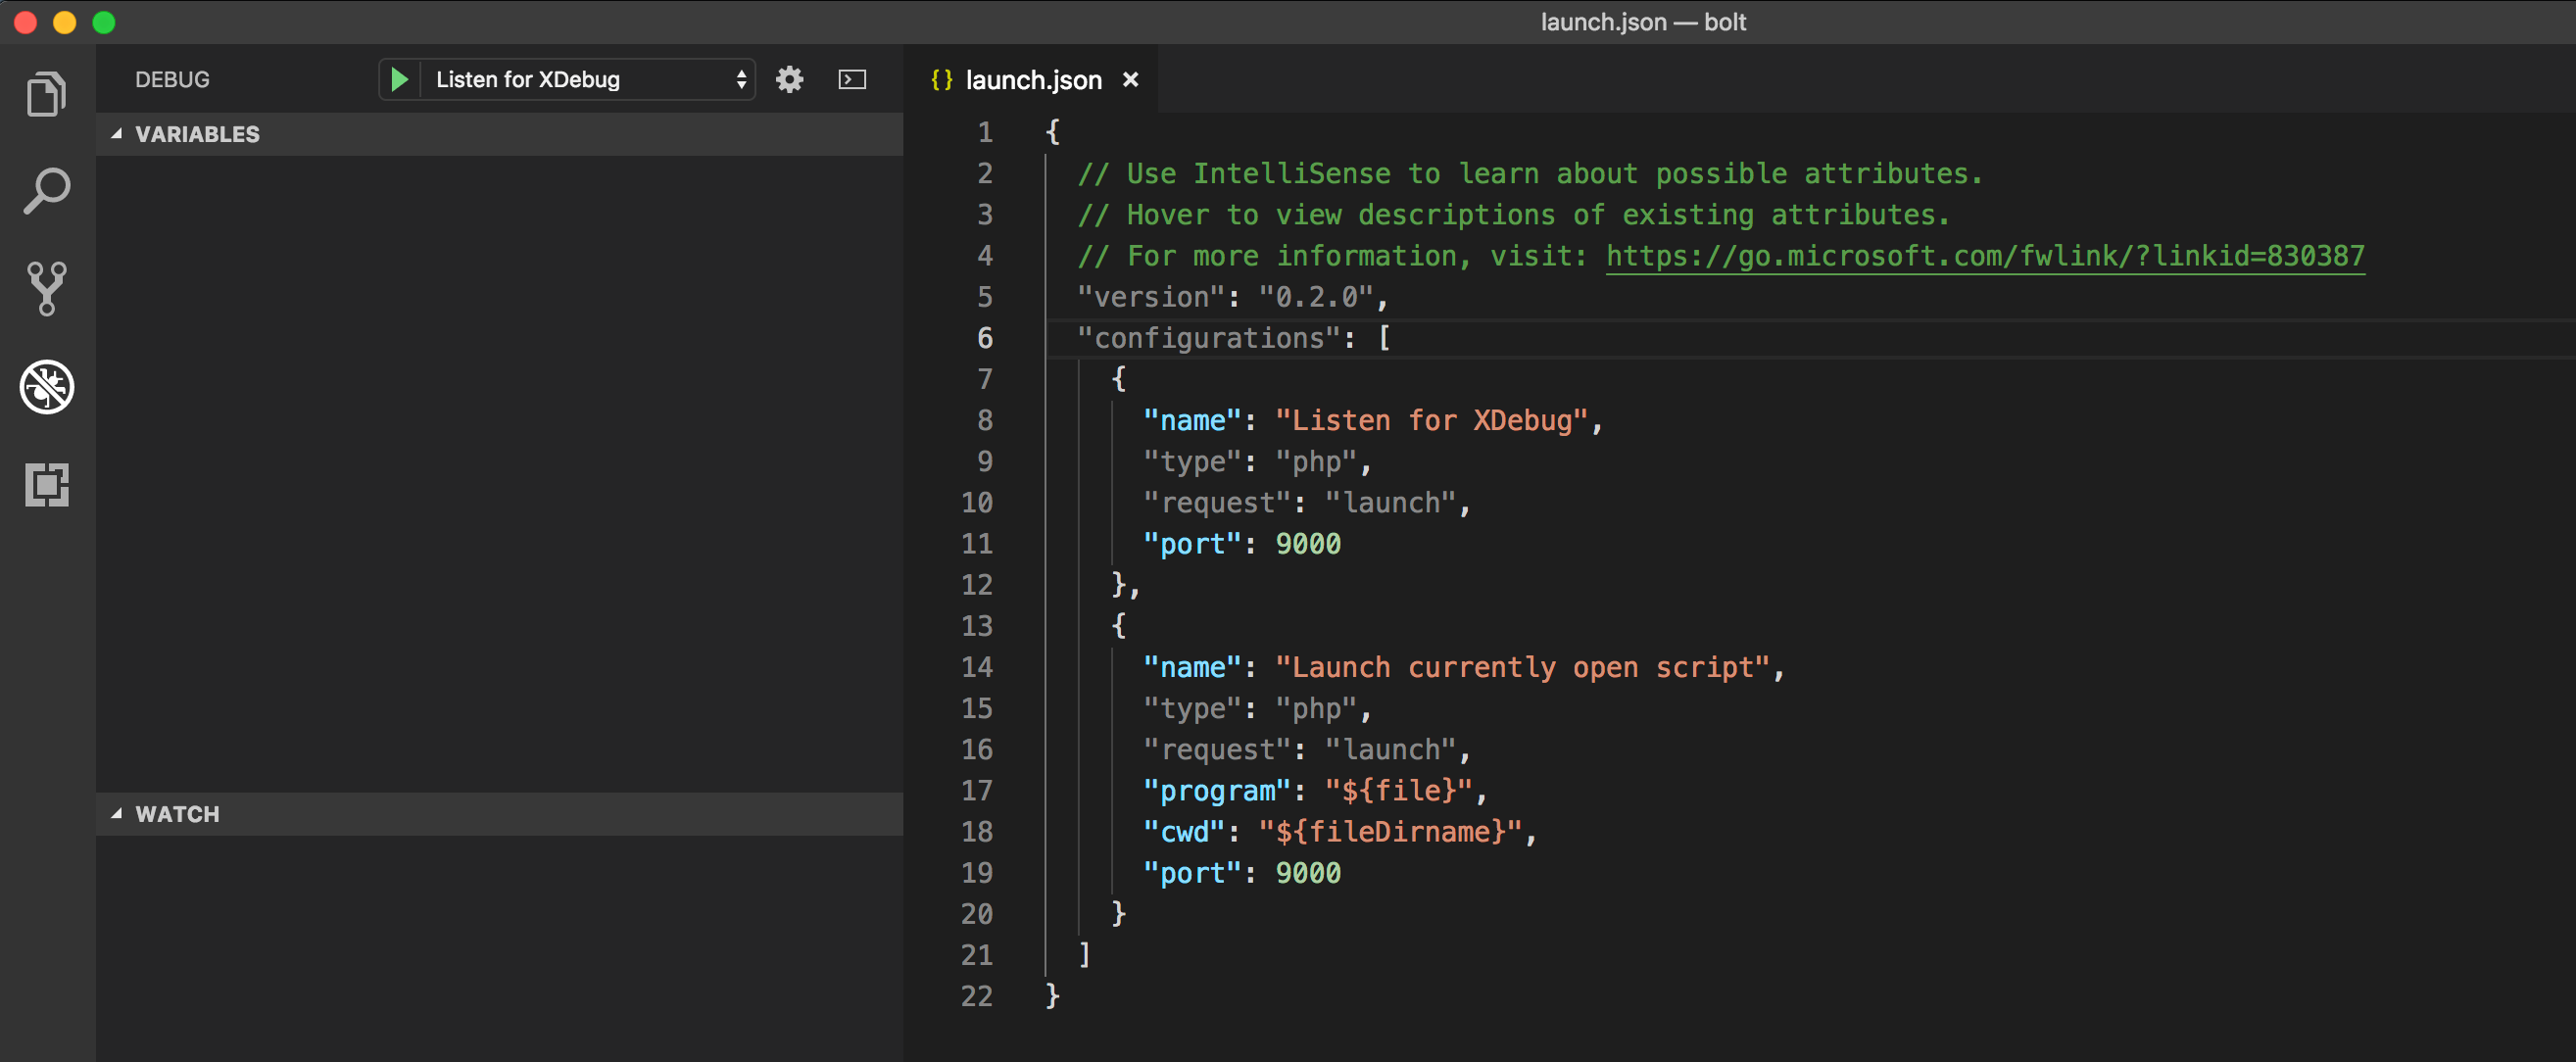
- Add a third entry to
launch.jsonwith the following:
{
   "name": "Build Pattern Lab",
   "type": "php",
   "request": "launch",
   "program": "${workspaceFolder}/docs-site/core/console",
   "args": ["--generate"],
   "cwd": "${workspaceFolder}/docs-site",
   "port": 9000,
   "runtimeArgs": [
      "-dmemory_limit=4048M",
      "-dzend_extension='/path/to/xdebug.so'",
      "-dxdebug.remote_enable=1",
      "-dxdebug.remote_port=9000",
      "-dxdebug.remote_autostart=1"
   ]
}
Note: Be sure to replace path/to/xdebug.so with your local path.
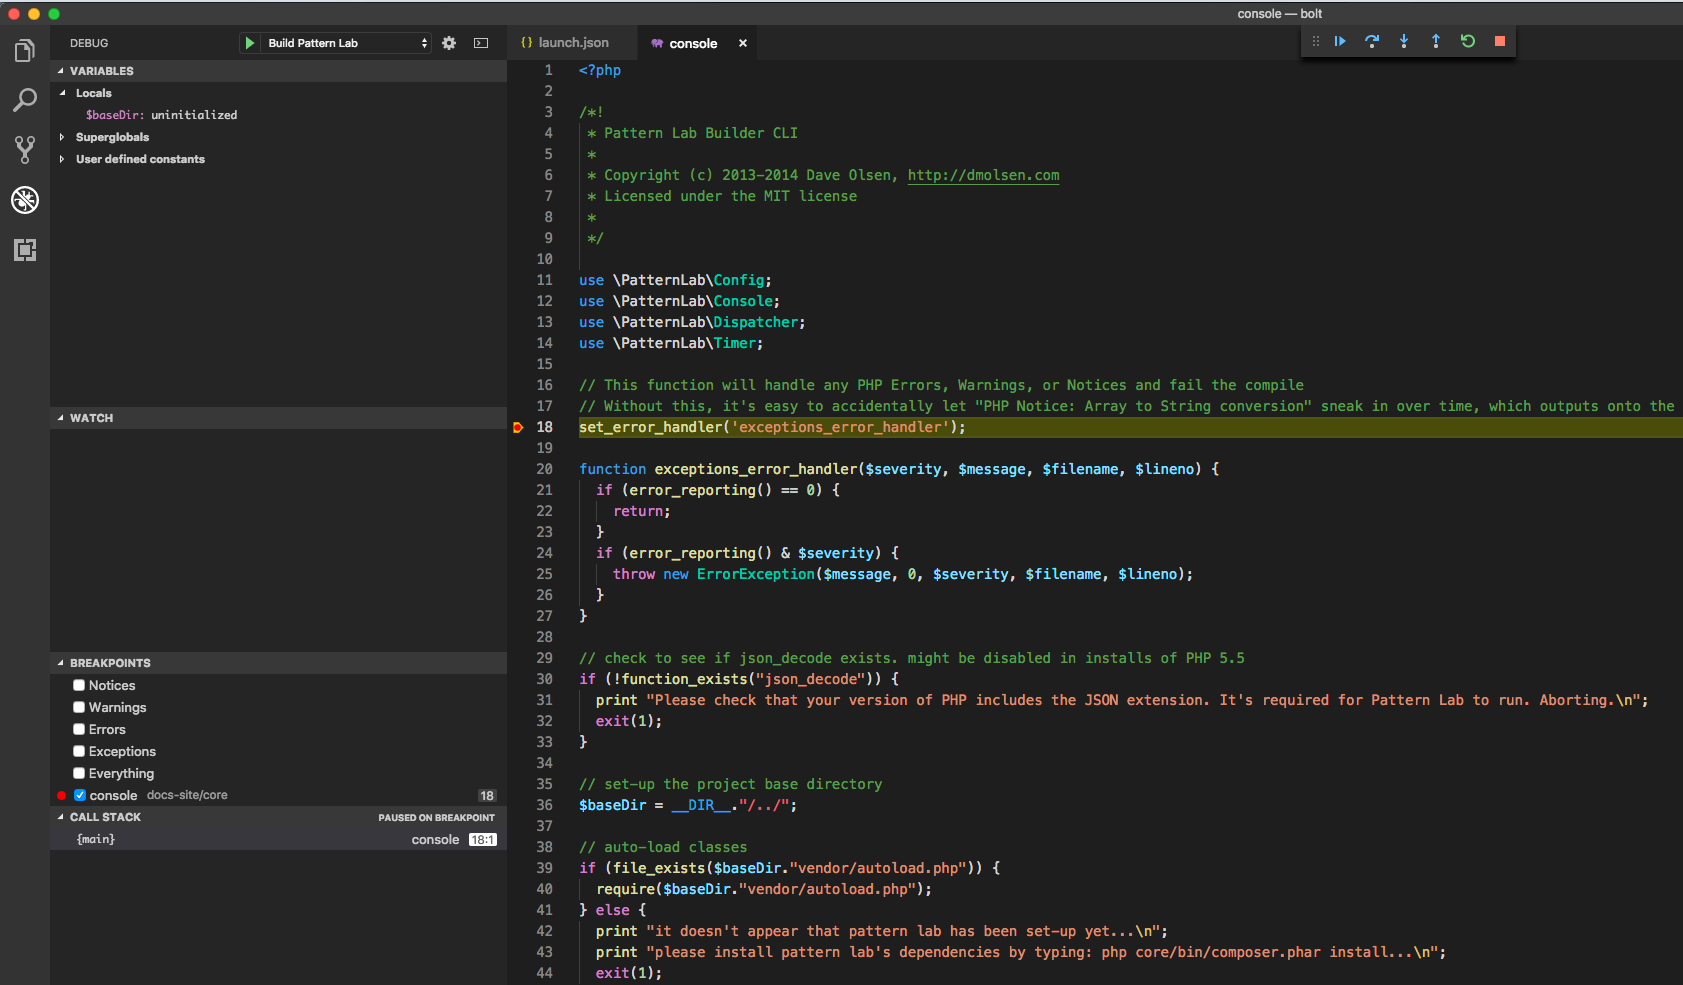
Step 3. Set a breakpoint
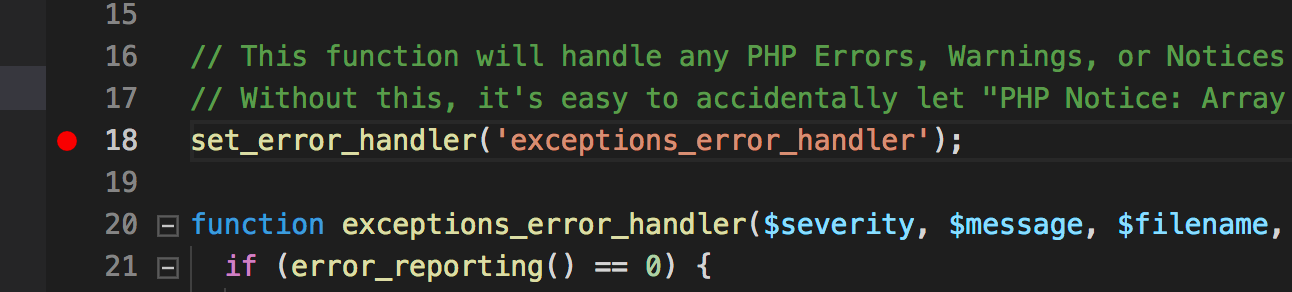
- Open the
docs-site/core/consolePHP file in VS Code - Click to the left of the line number on line 18 to set a breakpoint.
Step 4. Test the Debugger
- Back in the "Debug" pane, next to the gear icon, you will see a menu and a "play" icon
- Select "Build Pattern Lab" from the menu and click "play"
- Then, start up Pattern Lab by running
npm start
If you've done it right, execution should pause on the breakpoint you set.
Step 5. Cleanup
Comment out the xdebug lines you previously added to php.ini. Since PHP options are now being set at runtime by the Run/Debug script you set up in Step 2, you don't need them set globally anymore. Disabling them will disable xdebug when you're not actively debugging, which will improve performance significantly.
[Xdebug]
; zend_extension="/path/to/xdebug.so"
; xdebug.remote_enable=1
; xdebug.remote_autostart=1
; xdebug.remote_port="9000"
For more information, see: